Ten years of change

From a meteorologist’s point of view, the most significant change in the past 10 years has undoubtedly been the way technology has increased the amount of data available for describing the state of the atmosphere, with a corresponding increase in our power to predict what the weather will do next.
Weather satellites now transmit images not only of clouds but also of high-level water vapour, highlighting areas where cloud has not yet formed but is likely to do so. Calculations of high-level wind speeds are made on the basis of cloud displacements from one photo to the next, and these are routinely fed into computers which calculate the future state of the atmosphere.
Satellite instruments can also measure air temperature at different altitudes in the atmosphere over the vast areas of ocean that surround New Zealand, from which we have traditionally received only a handful of weather-balloon measurements of the upper atmosphere.
Satellites can also measure surface wind speeds over the ocean by transmitting pulses of microwave energy down to the sea surface and measuring the amount of that energy that is scattered back up to them. The stronger the wind, the rougher the sea surface and the greater the amount of microwave energy returned this development has proved useful in mapping some of the narrow, elongated rivers of strong wind that develop in New Zealand’s coastal waters near the ends of our mountain ranges.
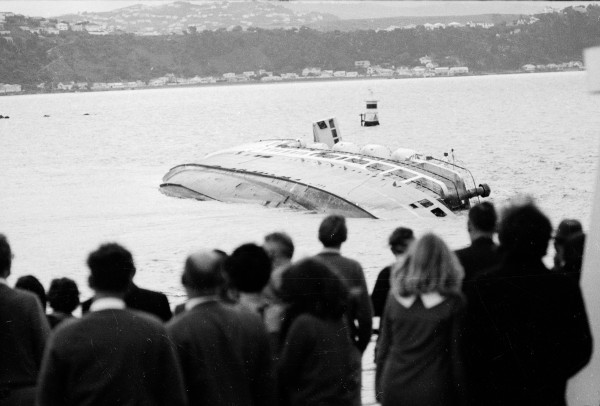
Although the automation of lighthouses in the 1980s meant a loss of human observation from these remote sites, this has mostly been compensated for by automatic weather stations that report every hour, day and night. These stations are particularly useful for keeping track of rainfall and following wind changes as they sweep across the country. However, they are unable to describe sea conditions or weather in the distance in the way a human observer can.
The lack of surface observations over the Great Southern Ocean has always been a problem for forecasters trying to create a picture of the weather approaching New Zealand. Now there is an international programme to release drifting buoys that report via satellite every few hours, providing measurements of surface pressure from areas where there may be no other surface observation for thousands of kilometres.
Weather-radar coverage of New Zealand has increased, too, and radar itself has become sufficiently sophisticated to measure the movement of raindrops within a storm and so determine its characteristic wind patterns. And, of course, computers have steadily grown more powerful, and are capable of handling more sophisticated models of the atmosphere, describing it in greater detail and predicting changes in it further into the future.
The result of all these developments is more accurate forecasts several days in advance.
The past decade has also seen progress made in seasonal forecasting. In particular, we have a much improved understanding of the phenomenon known as El Nino. Detailed measurements are now taken of ocean temperatures and currents, both at the sea surface and below, by dozens of tethered buoys spread across the tropical Pacific Ocean. Fed into sophisticated computer models, these helped to predict the dramatic El Nino event of last summer many months before it happened.
Our knowledge of climate change has also advanced, and especially the impact of climate change on history. A core taken recently from the floor of the Gulf of Oman was found to contain a thick layer of dust, indicative of drought, that has been dated to around 2200 BC. This was the time of the collapse of the Akkadian Empire in Mesopotamia, which stretched 1300 km from the Persian Gulf to the headwaters of the Euphrates in present-day Turkey and is regarded as the world’s first empire. Isotope analysis of radioactive strontium and neodymium in the dust layer showed that much of the dust came from Mesopotamia, blown 2000 km down the valley of the Tigris and Euphrates Rivers to the gulf by the north‑west wind known today as the Shamal. Analysis of the rest of the core indicated that this drought lasted almost 300 years and was the most severe of the past 10,000 years.
Evidence that this drought may have been a worldwide event has come from investigations in the United States and Peru. A dust layer dated to the same period has been found at the bottom of Elk Lake in Minnesota. Three times as much dust settled in the lake each year during the 100 years of the drought there as in each year of the infamous Dust Bowl period in the 1930s. In Peru, an ice core from a mountain glacier contains a dust spike indicative of a major drought in the Amazon basin about 2200 BC that appears to be the largest such event of the past 17,000 years.
Dust may not only be a consequence of climate change, it may also be a cause. A sea-floor core from the Atlantic has shown peaks in the concentration of helium 3, a marker for the interplanetary dust that swirls around the solar system. These peaks tend to occur every 100,000 years and correspond with the major fluctuations of temperature during the last million years of the Ice Age. It is thought that increased amounts of extraterrestrial dust in the upper atmosphere blocked a proportion of the incoming sunlight, thus reducing air temperatures in the lower atmosphere.
Some scientists, however, have argued that the amounts of dust concerned are too small to have had a significant effect, and claim that the coincidence with the 100,000-year cycle of lower temperatures is the result of regular small variations in the Earth’s orbit.
Interplanetary dust particles can also be used to measure the amount of oxygen in the atmosphere more than a billion years ago. As such particles enter the atmosphere at tens of kilometres per second, friction causes most to vaporise. But a few flash-melt at temperatures above 1500°C, interact with gases in the atmosphere in the few seconds they are molten, then solidify and fall to Earth.
With present levels of atmospheric oxygen, the iron and nickel in these particles—known as spherulesare totally oxidised, forming the oxides magnetite and wustite. In earlier times, when atmospheric oxygen was less abundant, only a portion of the iron and nickel was oxidised, so giving a measure of just how much oxygen there was.
Although spherules are usually badly affected by chemical weathering, some excellently preserved samples have been found in sandstone deposits in Finland formed 1.4 billion years ago.
On average about 40,000 tonnes of interplanetary dust hits the Earth each year, but the amount can increase when the planet travels through the orbit of a comet. When it passed through the orbit of Tempel-Tuttle in November 1998, there was a spectacular sky display in Asia, although not much could be seen from New Zealand. When the same thing happened in 1966, the United States got the best view, with 5000 shooting stars in a period of 20 minutes.
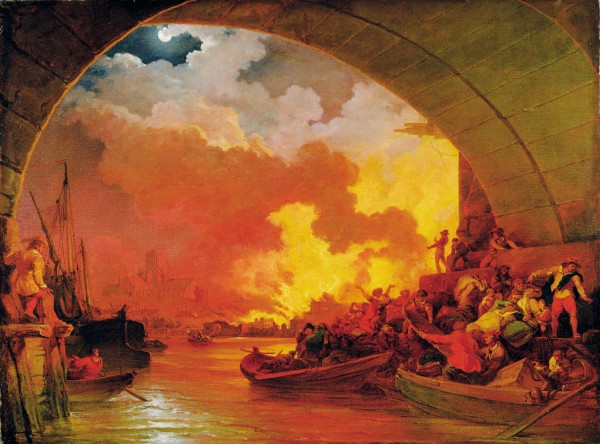
Astronomers have calculated that these displays would have been even more dramatic around 4000 years ago, and perhaps left their mark on early religions, many of which relate battles between sky gods. A folk memory of these events survives in the fire festivals many cultures still celebrate on the dates when the Earth encounters high dust levels in the orbits of a number of major comets.
Guy Fawkes Day is one example, the origins of which long predate the attempt by Catholic dissidents to blow up the English Parliament.
Equally intriguing is new evidence from Namibia supporting the theory that the Earth was like a giant snowball about 700 million years ago, with sea ice or glaciers stretching from pole to pole.
Part of the evidence for this is a big shift in the relative proportions of two isotopes of carbon found in sea-floor sediments. Photosynthetic organisms living in the seas before the glaciers developed took up carbon-12 from the water as they grew. This caused the ratio of carbon-13 to carbon-12 in the sea water to increase.
On the other hand, precipitation of dissolved carbonate onto the sea floor takes place in equal proportion, thereby preserving the ratio of the carbon isotopes so it can be measured today.
This ratio shows a steady decline as the glaciers are thought to have grown, indicating life in the sea was gradually being snuffed out as the ice spread across the oceans, cutting off the supply of sunlight to the organisms.
Once formed, the Earth’s icy coating kept it cold by reflecting most incoming sunlight back out to space.
This ice age is estimated to have lasted around 10 million years, until volcanic carbon dioxide, gradually oozing from inside the Earth, created a strong greenhouse effect that eventually broke the ice’s stranglehold.
The atmospheric carbon dioxide level is calculated to have been 350 times as high as today’s, causing a characteristic cap layer of carbonate to be deposited on the sea floor. As the ice retreated, life slowly returned to the oceans and the ratio of carbon-13 to carbon-12 gradually rose again.
We live in changing times, no doubt, but the record contained in the Earth’s ancient rocks shows it went through some pretty big changes long before we arrived on the scene.