Rising temperatures
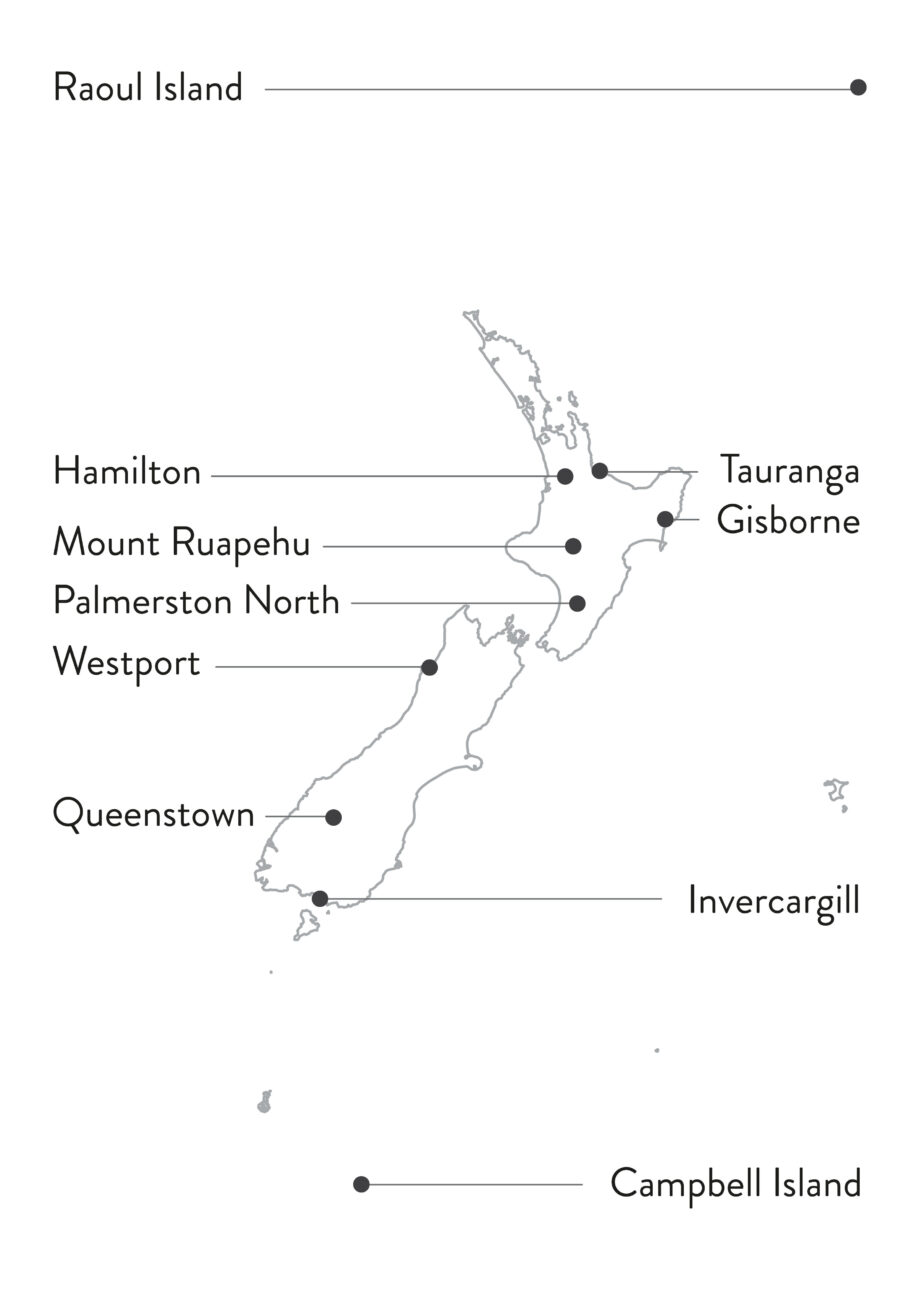
Ten New Zealand climate stations have operated from the same locations since at least the 1940s. The charts shown present data collected from these sites to address a simple question: Which years were warmer and cooler than the station’s average temperature?
The results are stark. Over the past 80 years, these places have recorded a warming trend close to 1°C. Aotearoa is getting hotter.
NIWA scientists forecast these trends will continue. Likely impacts include more intense winter rainfalls, drier summers and sea-level rise.
How to read
Charts show annual average temperature anomalies. Station averages are calculated from the 1961-90 climatalogical period. Positive bars represent warmer years than normal. Negative bars show cooler years. Gaps in a chart denote years with incomplete climate records.