Coastal winds
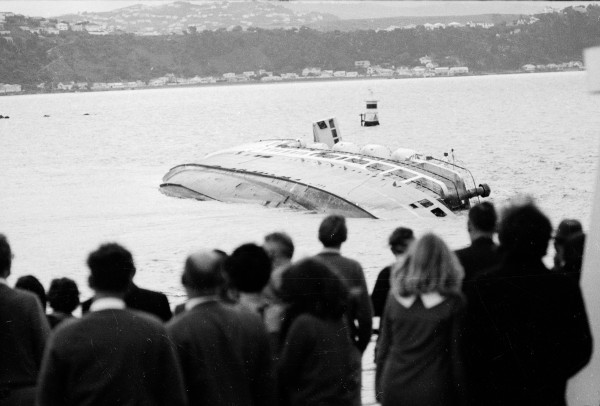
The desire to save lives by preventing shipwrecks was the spur that drove Robert FitzRoy to start issuing weather forecasts in England in 1860, when the science of meteorology was still rudimentary and weather observations were sparse. Following FitzRoy’s methods, Commander Edwin began forecasting for New Zealand’s coastal waters in May 1874. A retired naval officer and veteran of the Crimean War who had been wounded at Sebastopol, Edwin was employed by the Marine Department to instigate and disseminate warnings of hazardous weather. At this time, around 25 vessels were lost each year along the coast of New Zealand.
An initial system, begun in 1869, had seen weather observations, taken at 26 telegraph offices around the country, publicly displayed at ports. This had been a disappointment, in part because of the poor standard of the observations, which had been made by untrained telegraph staff with little time to spare from their other duties. Edwin oversaw the distribution of barometers to 17 coastal stations and ran up a telegraph bill of 800 pounds a year in transmitting the observations and consequent forecasts. The expense gave the colonial administrators pause for thought, but the forecasts met with enough success that Edwin continued forecasting for 32 years, ceasing only when he retired in 1908, age 69.
As meteorological knowledge has increased, it has become apparent that coastal weather can be more extreme than weather over the open ocean. The hills and mountains of New Zealand are a complex obstacle in the path of weather coming off the ocean. The land breaks the wind patterns into an intricate mosaic of microclimates that vary with wind direction and atmospheric stability. When the wind is blocked by a mountain range, much of the air flows round the ends of the range, creating an area of gale-force winds that can extend hundreds of kilometres downstream. Cook Strait and the sea west of Puysegur Point, in southern Fiordland, are good examples of places where this happens.
Another is the area around East Cape. When a south-easterly airstream blows towards the Gisborne area, gales are typically generated near the Cape and continue downstream as far as Great Barrier Island. If an anticyclone is crossing the North Island and the air is very stable, a modest flow of 20 knots over the open ocean can easily double to 40 knots near the Cape as most of the air streams round the ends of the Raukumara Range. Although the wind speed of 40 knots may hold all the way to the Barrier, over much of the Bay of Plenty, closer in towards Whakatane and Tauranga, it can be as light as 10 knots.
Anticyclones are associated with a stable atmosphere, because the air inside them has typically descended from a considerable height. During its descent, the air is warmed by compression, creating a strong temperature inversion between the falling air and the cooler air next to the sea or land surface. Buoyancy forces trap the cooler, denser air near the surface, so that it flows round obstacles rather than over them.
When such an inversion near East Cape is lower than about 900 m, most of the air in the south-easterly flow is diverted round the northern end of the Raukumaras. If the inversion is a little higher, say 1200 m, the taller peaks of the Raukumara Range still block the south-easterly but air now spills round both ends of the mountain range. A good example of this was recorded by satellite scatterometer on the morning of 24 August 2003. The resulting computer-generated weather map (below)shows a zone of relatively light 10–15 knots winds, extending downstream from the highest part of the ranges, sandwiched between a belt of 25–30 knots winds close inshore and 30–40 knots winds further out to sea.
Meanwhile, back round the corner, east of Gisborne and Hawke’s Bay, another interesting wind pattern is develops in a south-easterly flow. As air piles up against the land, the atmospheric pressure there increases by a few hectopascals, producing lighter winds blowing from the south-west—perpendicular to the main south-easterly flow—in a strip about 10 km wide. Typically, the wind 50 km out to sea is 15–20 knots from the south-east, while close to the coast it is only 5–10 knots from the south-west.
This “damming” of the air against the land is also a feature of strong-wind situations. When a front sweeps across New Zealand from the Tasman Sea with a band of northerly gales ahead of it, the wind hard up against the coast is often much lighter than gale force until perhaps the last hour before the front passes. Then a wind of about 25 knots from the north-east swings round to 45 knots from the north and the full force of the gale brings savage conditions to the shore in a short but deadly burst.
A feature of the weather map when these strong pre-frontal winds are flowing is the way the isobars have an extra kink in them where they cross the Southern Alps. Known as a lee-trough, this marks an area of lower air pressure that forms downwind of the mountains. The isobars are usually very close together around the top of the lee-trough, where the mountains end near Cook Strait. This can be seen on the map for 16 March 1992, when there was a north-west wind of 65 knots in the strait at Brothers Island, while over the Tasman Sea ahead of the front the wind was only around 35 knots.
However, not all gales have such a clear signal in the isobar pattern. When a high drifts across the South Island, a small shift in the angle of the isobars crossing the North Island can cause a southerly through Cook Strait to increase from 10 knots to gale force.
Coastal forecasts cover waters out to 100 km from the land. The coastal waters are broken into 18 separate areas, each of several thousand square kilometres. Given the variety of local conditions and the need to be brief, forecasts concentrate on the predominant winds and main trends. A detailed forecast for a typical area could easily cover half a page or more, but the demands of broadcasting require each forecast to be kept to a few lines. The forecasts and a map of the areas are available on the MetService website—www.metservice.com.
In recent decades, weather forecasts have steadily improved as ever-more powerful computers have grappled with the complexities of the atmosphere, and the number and quality of observations have increased. In particular, satellite-scatterometer measurements of winds have been a great help in clarifying the initial conditions over the oceans of the Southern hemisphere. Thousands of observations are made each day over areas where once you would have been lucky to get one or two ship reports, meaning weather maps are now sufficiently reliable for MetService to issue extended-range coastal forecasts up to five days ahead, something it began doing in May 2005, 121 years after Edwin’s first forecasts. Judging by the reaction so far, these have been well received by most mariners, even if there are more words to listen to.